On May 9, data from the General Administration of Customs showed that China exported 9.498 million mt of steel in April 2026, up 363,000 mt MoM, a 4.0% increase MoM; cumulative steel exports from January to April totaled 34.214 million mt, down 9.7% YoY.
In April 2026, China imported 465,000 mt of steel, down 47,000 mt MoM, a 9.2% decrease MoM; cumulative steel imports from January to April totaled 1.804 million mt, down 13.4% YoY.
- China's Steel Exports Continued to Increase MoM in April
According to SMM's April export schedule survey, HRC export plans for the month were 851,000 mt, up 67,000 mt from actual exports in March, an 8.5% increase MoM. Meanwhile, SMM export order data showed that as production gradually resumed in March and ex-China demand recovered somewhat, combined with the semi-finished products gap caused by the US-Iran conflict, China leveraged its perfect price advantage and superior geographical location to effectively capture Southeast Asian semi-finished products import demand. This led to export orders increasing by over 30% MoM in March. However, since the incremental data was mostly semi-finished products, the impact may become more apparent when the late-month product-specific data is released.
- China's Steel Imports Increased MoM in March
Import side, from January to March, China's cumulative steel imports totaled 1.804 million mt, down 13.4% YoY; net steel exports reached 32.41 million mt.
- Short-Term Steel Export Outlook
According to S&P Global data, the global manufacturing PMI in April 2026 was 52.6%, up 1.3 percentage points MoM, operating above 50% for 13 consecutive months. The US was in strong expansion territory, and other European and American countries were also in expansion territory. In April, China's manufacturing new export orders index was 50.3%, up 4.1 percentage points MoM, finally returning to expansion territory after 24 months.
World Steel Association monitoring data showed that global crude steel production in March 2026 fell 4.2% YoY to 159.9 million mt. China's production pullback was mainly driven by steel mills proactively cutting production as profits were squeezed. Excluding China, global production in other regions also declined 0.55% MoM, with significant divergence in production schedule pace across regions. In markets outside China, India maintained high production schedules, boosted by fiscal year-end target sprints, up 9.4% YoY. In contrast, the Middle East (particularly Iran) saw production plunge 33.5% YoY. The continued contraction in Middle Eastern production has created structural opportunities for China's steel exports, particularly semi-finished products exports.
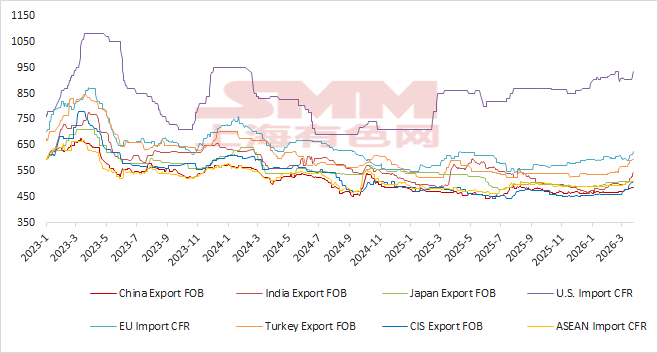
As of May 8, 2026, HRC export prices (FOB) for India, Turkey, and the CIS were $507/mt, $640/mt, and $525/mt respectively, while China's HRC export price (FOB) was $507/mt. Currently, China's HRC export prices were -$73/mt, -$133/mt, and -$18/mt compared to these countries respectively. The price spread advantage showed no significant change MoM. Overall, China's steel export price advantage remains significant.
Chart 1 - Global Major Market HRC Prices
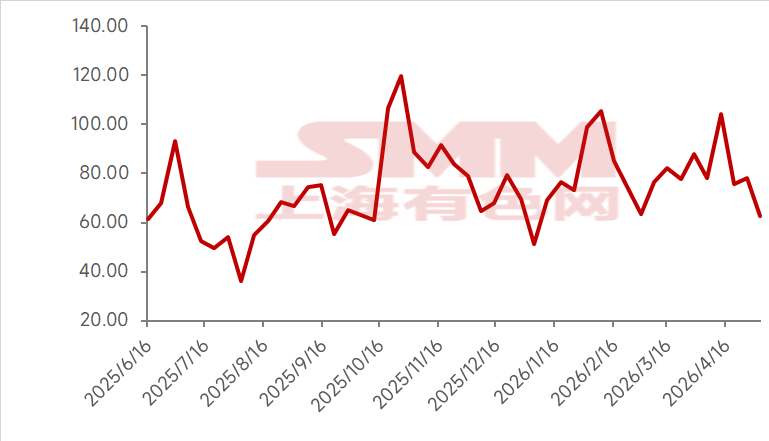
Based on SMM's latest steel mill export order schedule, HRC export plans for this month were 1.1435 million mt, up 213,500 mt from actual exports last month, a 23% increase MoM.
According to SMM steel export order data, affected by holidays, steel export orders in April weakened slightly by 0.57% MoM from March. However, it was also learned that shipping to the Middle East is gradually recovering, with some cargo currently being unloaded at Fujairah Port in the UAE and then transported overland to other Middle Eastern countries. Slab orders destined for Southeast Asia also increased notably in April, with shipping dates mostly in May-June.
Taking all factors into consideration, with the new export orders index returning to expansion territory, export price advantages remaining significant, and strong export order performance, SMM expects China's steel exports to continue increasing in May, with semi-finished products continuing to contribute the dominant force!
Chart 2 - SMM Steel Export Order Volume
Note: This article is original content of this official account. For reprinting, whitelisting, or cooperation needs, please contact us. Without permission, the content above shall not be reprinted, modified, used, sold, transferred, displayed, translated, compiled, disseminated, or disclosed to third parties in any other form, nor shall third parties be licensed to use it. Otherwise, once discovered, SMM will take legal measures to pursue infringement liability, including but not limited to demanding contractual breach liability, return of unjust enrichment, and compensation for direct and indirect economic losses.
![[SMM Hot-Rolled Coil Daily Trading] Spot Cargo Trading Volume Changed Narrowly](https://imgqn.smm.cn/usercenter/JAnHq20251217171716.jpg)

![[SMM Sheets & Plates Daily Review] Prices held up well during the day; trading activity was moderate](https://imgqn.smm.cn/usercenter/LSkpO20251217171720.jpg)